qiskit.visualization.plot_state_paulivec#
- qiskit.visualization.plot_state_paulivec(state, title='', figsize=None, color=None, ax=None, *, rho=None, filename=None)[소스]#
Plot the Pauli-vector representation of a quantum state as bar graph.
The Pauli-vector of a density matrix \(\rho\) is defined by the expectation of each possible tensor product of single-qubit Pauli operators (including the identity), that is
\[\rho = \frac{1}{2^n} \sum_{\sigma \in \{I, X, Y, Z\}^{\otimes n}} \mathrm{Tr}(\sigma \rho) \sigma.\]This function plots the coefficients \(\mathrm{Tr}(\sigma\rho)\) as bar graph.
버전 0.15.1부터 폐지됨:
qiskit.visualization.state_visualization.plot_state_paulivec()’s argumentrhois deprecated as of qiskit-terra 0.15.1. It will be removed no earlier than 3 months after the release date. Instead, use the argumentstate, which behaves identically.- 매개변수:
state (Statevector or DensityMatrix or ndarray) – an N-qubit quantum state.
title (str) – a string that represents the plot title
figsize (tuple) – Figure size in inches.
ax (matplotlib.axes.Axes) – An optional Axes object to be used for the visualization output. If none is specified a new matplotlib Figure will be created and used. Additionally, if specified there will be no returned Figure since it is redundant.
- 반환:
The matplotlib.Figure of the visualization if the
axkwarg is not set- 반환 형식:
- 예외 발생:
MissingOptionalLibraryError – Requires matplotlib.
VisualizationError – if input is not a valid N-qubit state.
예제
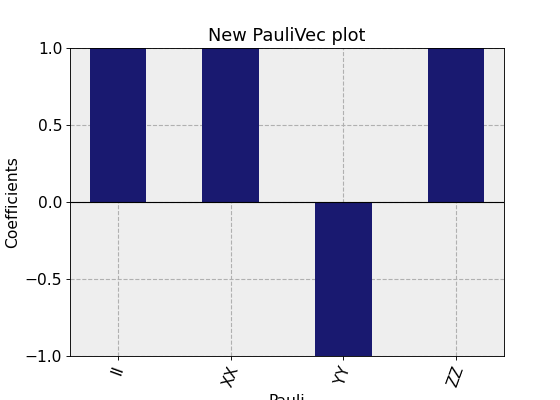
# You can set a color for all the bars.

from qiskit import QuantumCircuit
from qiskit.quantum_info import Statevector
from qiskit.visualization import plot_state_paulivec

qc = QuantumCircuit(2)
qc.h(0)
qc.cx(0, 1)

state = Statevector(qc)
plot_state_paulivec(state, color='midnightblue', title="New PauliVec plot")
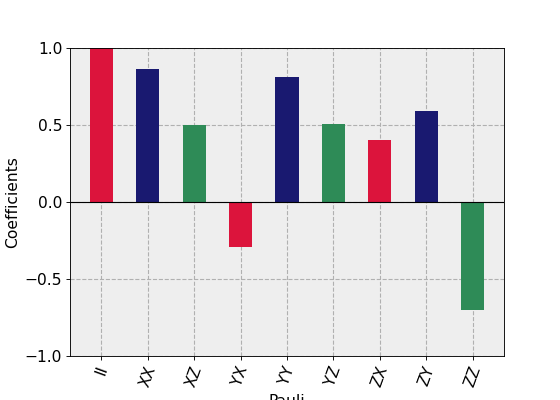
# If you introduce a list with less colors than bars, the color of the bars will
# alternate following the sequence from the list.

import numpy as np
from qiskit.quantum_info import DensityMatrix
from qiskit import QuantumCircuit
from qiskit.visualization import plot_state_paulivec

qc = QuantumCircuit(2)
qc.h(0)
qc.cx(0, 1)

qc = QuantumCircuit(2)
qc.h([0, 1])
qc.cz(0, 1)
qc.ry(np.pi/3, 0)
qc.rx(np.pi/5, 1)

matrix = DensityMatrix(qc)
plot_state_paulivec(matrix, color=['crimson', 'midnightblue', 'seagreen'])