qiskit.visualization.plot_bloch_multivector#
- qiskit.visualization.plot_bloch_multivector(state, title='', figsize=None, *, rho=None, reverse_bits=False, filename=None, font_size=None, title_font_size=None, title_pad=1)[ソース]#
Plot a Bloch sphere for each qubit.
Each component \((x,y,z)\) of the Bloch sphere labeled as 『qubit i』 represents the expected value of the corresponding Pauli operator acting only on that qubit, that is, the expected value of \(I_{N-1} \otimes\dotsb\otimes I_{i+1}\otimes P_i \otimes I_{i-1}\otimes\dotsb\otimes I_0\), where \(N\) is the number of qubits, \(P\in \{X,Y,Z\}\) and \(I\) is the identity operator.
バージョン 0.15.1 で非推奨:
qiskit.visualization.state_visualization.plot_bloch_multivector()』s argumentrhois deprecated as of qiskit-terra 0.15.1. It will be removed no earlier than 3 months after the release date. Instead, use the argumentstate, which behaves identically.- パラメータ:
state (Statevector or DensityMatrix or ndarray) – an N-qubit quantum state.
title (str) – a string that represents the plot title
figsize (tuple) – size of each individual Bloch sphere figure, in inches.
reverse_bits (bool) – If True, plots qubits following Qiskit’s convention [Default:False].
font_size (float) – Font size for the Bloch ball figures.
title_font_size (float) – Font size for the title.
title_pad (float) – Padding for the title (suptitle y position is y=1+title_pad/100).
- 戻り値:
A matplotlib figure instance.
- 戻り値の型:
- 例外:
MissingOptionalLibraryError – Requires matplotlib.
VisualizationError – if input is not a valid N-qubit state.
サンプル
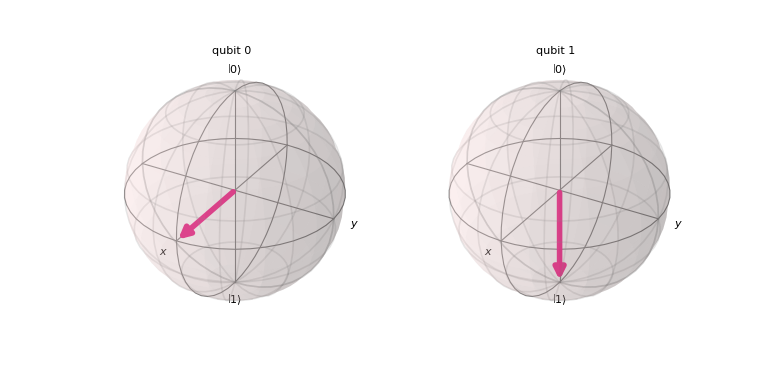
from qiskit import QuantumCircuit
from qiskit.quantum_info import Statevector
from qiskit.visualization import plot_bloch_multivector

qc = QuantumCircuit(2)
qc.h(0)
qc.x(1)

state = Statevector(qc)
plot_bloch_multivector(state)
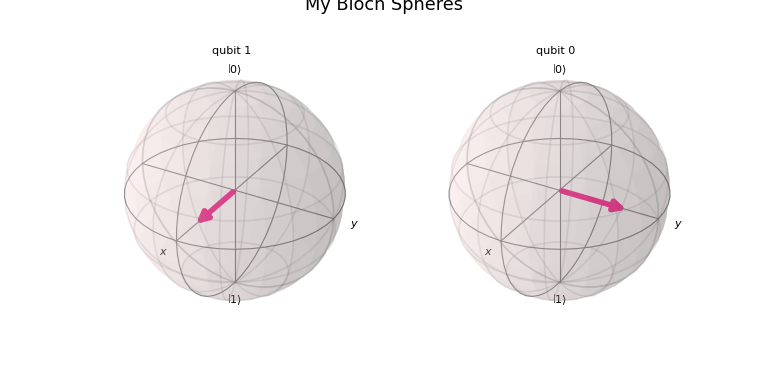
from qiskit import QuantumCircuit
from qiskit.quantum_info import Statevector
from qiskit.visualization import plot_bloch_multivector

qc = QuantumCircuit(2)
qc.h(0)
qc.x(1)

# You can reverse the order of the qubits.

from qiskit.quantum_info import DensityMatrix

qc = QuantumCircuit(2)
qc.h([0, 1])
qc.t(1)
qc.s(0)
qc.cx(0,1)

matrix = DensityMatrix(qc)
plot_bloch_multivector(matrix, title='My Bloch Spheres', reverse_bits=True)