Visualizations (qiskit.visualization)#
The visualization module contain functions that visualizes measurement outcome counts, quantum states, circuits, pulses, devices and more.
To use visualization functions, you are required to install visualization optionals to your development environment:
pip install 'qiskit[visualization]'
Common Keyword Arguments#
Many of the figures created by visualization functions in this module are created by Matplotlib and accept a subset of the following common arguments. Consult the individual documentation for exact details.
title(str): a text string to use for the plot title.legend(list): a list of strings to use for labels of the data.figsize(tuple): figure size in inches .color(list): a list of strings for plotting.ax(matplotlib.axes.Axes): An optionalAxesobject to be used for the visualization output. If none is specified a new matplotlib.figure.Figure will be created and used. Additionally, if specified there will be no returnedFiguresince it is redundant.filename(str): file path to save image to.
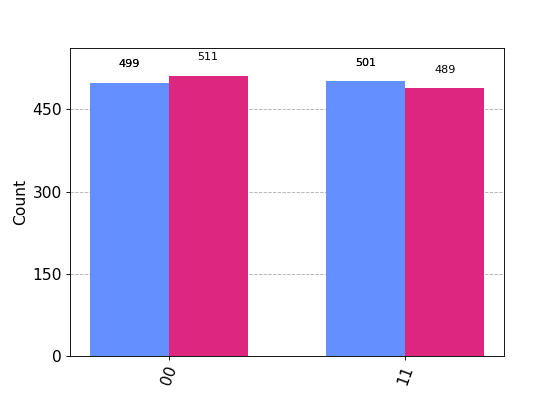
The following example demonstrates the common usage of these arguments:
from qiskit.visualization import plot_histogram

counts1 = {'00': 499, '11': 501}
counts2 = {'00': 511, '11': 489}

data = [counts1, counts2]
plot_histogram(data)
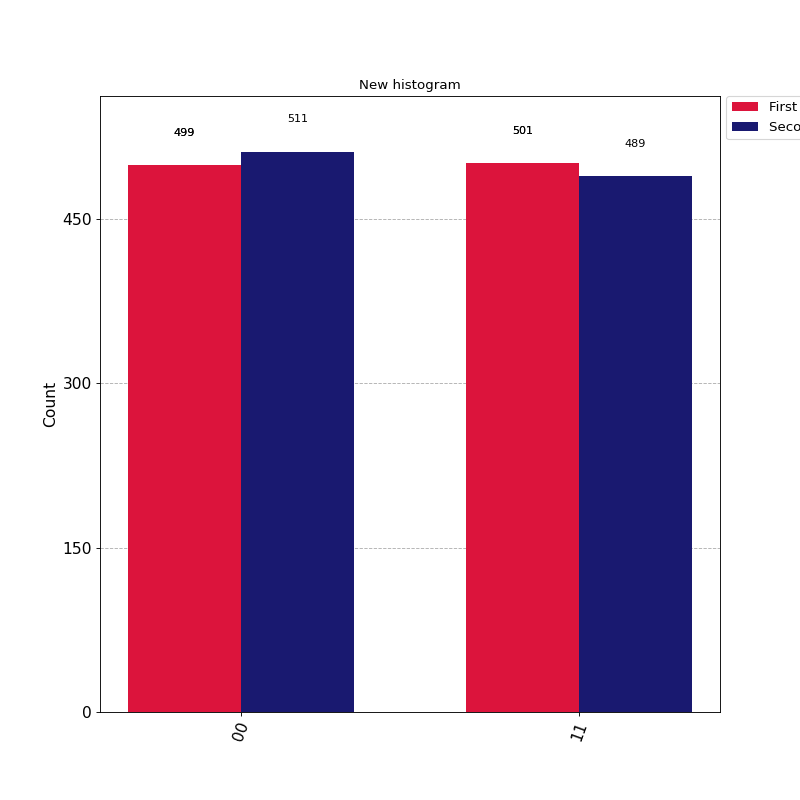
You can specify legend, title, figsize and color by passing to the kwargs.
from qiskit.visualization import plot_histogram

counts1 = {'00': 499, '11': 501}
counts2 = {'00': 511, '11': 489}
data = [counts1, counts2]

legend = ['First execution', 'Second execution']
title = 'New histogram'
figsize = (10,10)
color=['crimson','midnightblue']
plot_histogram(data, legend=legend, title=title, figsize=figsize, color=color)
You can save the figure to file either by passing the file name to filename kwarg or use
matplotlib.figure.Figure.savefig method.
plot_histogram(data, filename='new_hist.png')

hist = plot_histogram(data)
hist.savefig('new_hist.png')
Counts Visualizations#
This section contains functions that visualize measurement outcome counts.
|
Plot a histogram of input counts data. |
Example Usage#
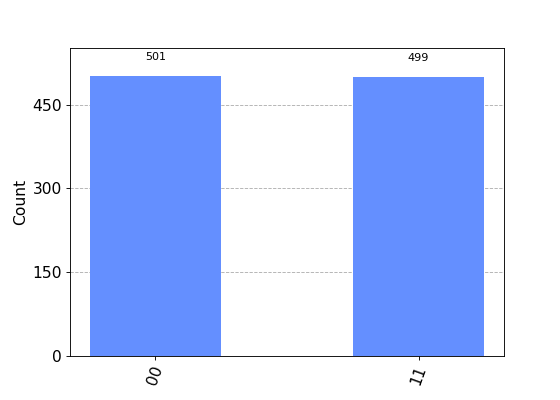
Here is an example of using plot_histogram() to visualize measurement outcome counts:
from qiskit.visualization import plot_histogram

counts = {"00": 501, "11": 499}
plot_histogram(counts)
The data can be a dictionary with bit string as key and counts as value, or more commonly a
Counts object obtained from get_counts().
Distribution Visualizations#
This section contains functions that visualize sampled distributions.
|
Plot a distribution from input sampled data. |
State Visualizations#
This section contains functions that visualize quantum states.
|
Plot the Bloch sphere. |
|
Plot a Bloch sphere for each qubit. |
|
Plot the cityscape of quantum state. |
|
Plot a hinton diagram for the density matrix of a quantum state. |
|
Plot the Pauli-vector representation of a quantum state as bar graph. |
|
Plot the qsphere representation of a quantum state. |
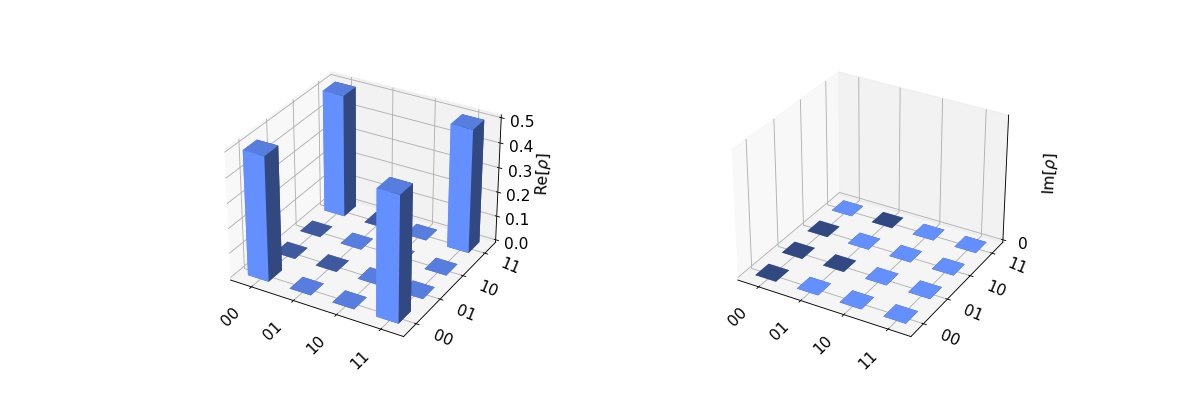
Example Usage#
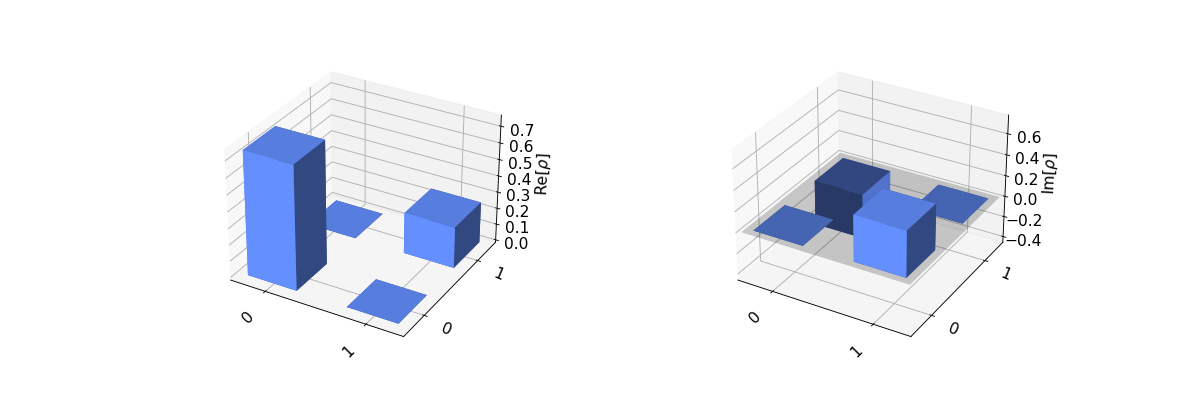
Here is an example of using plot_state_city() to visualize a quantum state:
from qiskit.visualization import plot_state_city

state = [[ 0.75  , 0.433j],
         [-0.433j, 0.25  ]]
plot_state_city(state)
The state can be array-like list of lists, numpy.array, or more commonly
Statevector or DensityMatrix objects
obtained from a QuantumCircuit:
from qiskit import QuantumCircuit
from qiskit.quantum_info import Statevector
from qiskit.visualization import plot_state_city

qc = QuantumCircuit(2)
qc.h(0)
qc.cx(0,1)

# plot using a Statevector
state = Statevector(qc)
plot_state_city(state)

from qiskit import QuantumCircuit
from qiskit.quantum_info import DensityMatrix
from qiskit.visualization import plot_state_city

qc = QuantumCircuit(2)
qc.h(0)
qc.cx(0,1)

# plot using a DensityMatrix
state = DensityMatrix(qc)
plot_state_city(state)
You can find code examples for each visualization functions on the individual function API page.
Device Visualizations#
|
Plots the gate map of a device. |
|
Plots the error map of a given backend. |
|
Plot the layout of a circuit transpiled for a given target backend. |
|
Plots an arbitrary coupling map of qubits (embedded in a plane). |
Circuit Visualizations#
|
Draw the quantum circuit. |
Creates a Default Style dictionary |
DAG Visualizations#
|
Plot the directed acyclic graph (dag) to represent operation dependencies in a quantum circuit. |
Pass Manager Visualizations#
|
Draws the pass manager. |
Pulse Visualizations#
|
Generate visualization data for pulse programs. |
|
Standard pulse stylesheet. |
|
Simple pulse stylesheet without channel notation. |
|
Pulse stylesheet for pulse programmers. |
Timeline Visualizations#
|
Generate visualization data for scheduled circuit programs. |
Single Qubit State Transition Visualizations#
|
Creates animation showing transitions between states of a single qubit by applying quantum gates. |
Array/Matrix Visualizations#
|
Latex representation of a complex numpy array (with dimension 1 or 2) |