qiskit.visualization.plot_state_qsphere#
- qiskit.visualization.plot_state_qsphere(state, figsize=None, ax=None, show_state_labels=True, show_state_phases=False, use_degrees=False, *, rho=None, filename=None)[Quellcode]#
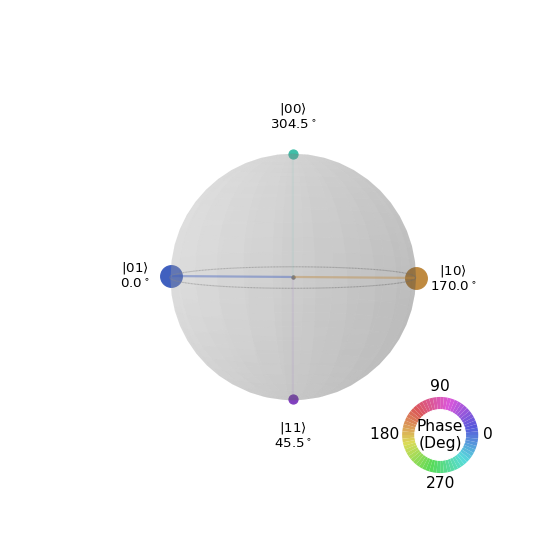
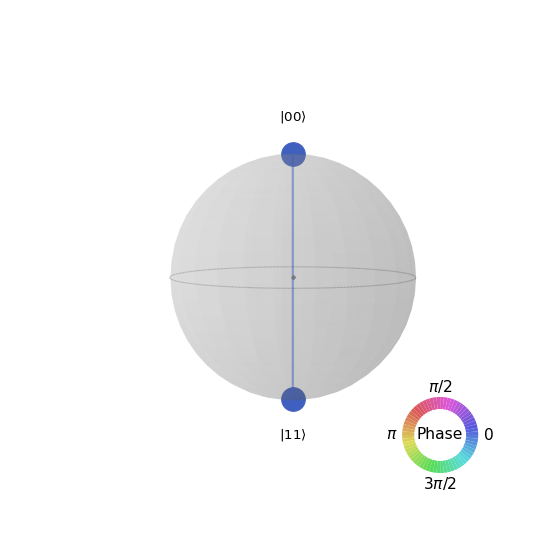
Plot the qsphere representation of a quantum state. Here, the size of the points is proportional to the probability of the corresponding term in the state and the color represents the phase.
Veraltet ab Version 0.15.1:
qiskit.visualization.state_visualization.plot_state_qsphere()‘s argumentrhois deprecated as of qiskit-terra 0.15.1. It will be removed no earlier than 3 months after the release date. Instead, use the argumentstate, which behaves identically.- Parameter:
state (Statevector or DensityMatrix or ndarray) – an N-qubit quantum state.
figsize (tuple) – Figure size in inches.
ax (matplotlib.axes.Axes) – An optional Axes object to be used for the visualization output. If none is specified a new matplotlib Figure will be created and used. Additionally, if specified there will be no returned Figure since it is redundant.
show_state_labels (bool) – An optional boolean indicating whether to show labels for each basis state.
show_state_phases (bool) – An optional boolean indicating whether to show the phase for each basis state.
use_degrees (bool) – An optional boolean indicating whether to use radians or degrees for the phase values in the plot.
- Rückgabe:
A matplotlib figure instance if the
axkwarg is not set- Rückgabetyp:
- Verursacht:
MissingOptionalLibraryError – Requires matplotlib.
VisualizationError – if input is not a valid N-qubit state.
QiskitError – Input statevector does not have valid dimensions.
Examples
from qiskit import QuantumCircuit
from qiskit.quantum_info import Statevector
from qiskit.visualization import plot_state_qsphere

qc = QuantumCircuit(2)
qc.h(0)
qc.cx(0, 1)

state = Statevector(qc)
plot_state_qsphere(state)
# You can show the phase of each state and use
# degrees instead of radians

from qiskit.quantum_info import DensityMatrix
import numpy as np
from qiskit import QuantumCircuit
from qiskit.visualization import plot_state_qsphere

qc = QuantumCircuit(2)
qc.h([0, 1])
qc.cz(0,1)
qc.ry(np.pi/3, 0)
qc.rx(np.pi/5, 1)
qc.z(1)

matrix = DensityMatrix(qc)
plot_state_qsphere(matrix,
     show_state_phases = True, use_degrees = True)