qiskit.visualization.plot_state_qsphere#
- qiskit.visualization.plot_state_qsphere(state, figsize=None, ax=None, show_state_labels=True, show_state_phases=False, use_degrees=False, *, rho=None, filename=None)[source]#
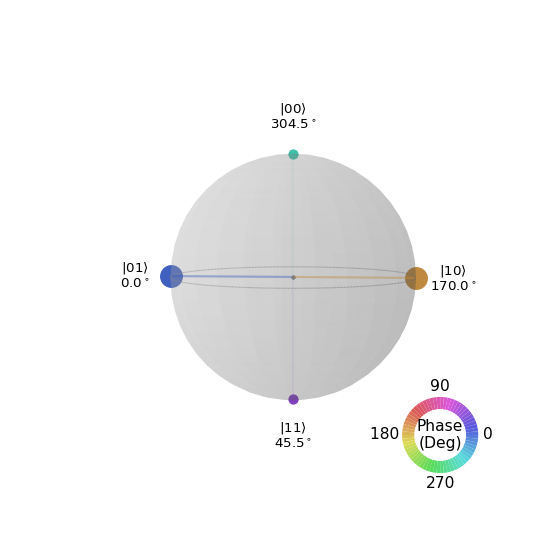
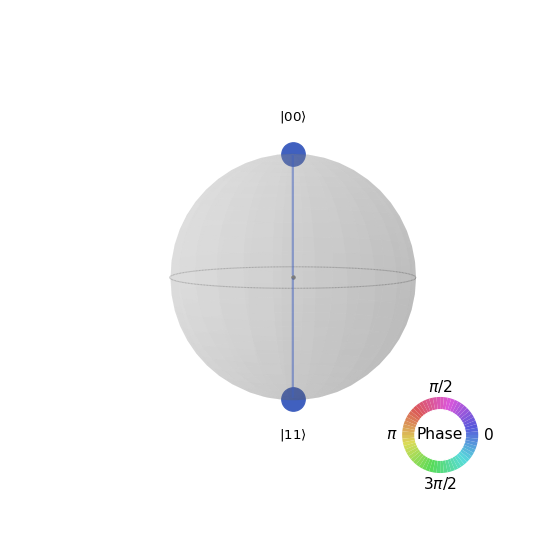
Plot the qsphere representation of a quantum state. Here, the size of the points is proportional to the probability of the corresponding term in the state and the color represents the phase.
Obsolète depuis la version 0.15.1:
qiskit.visualization.state_visualization.plot_state_qsphere()”s argumentrhois deprecated as of qiskit-terra 0.15.1. It will be removed no earlier than 3 months after the release date. Instead, use the argumentstate, which behaves identically.- Paramètres:
state (Statevector or DensityMatrix or ndarray) – an N-qubit quantum state.
figsize (tuple) – Figure size in inches.
ax (matplotlib.axes.Axes) – An optional Axes object to be used for the visualization output. If none is specified a new matplotlib Figure will be created and used. Additionally, if specified there will be no returned Figure since it is redundant.
show_state_labels (bool) – An optional boolean indicating whether to show labels for each basis state.
show_state_phases (bool) – An optional boolean indicating whether to show the phase for each basis state.
use_degrees (bool) – An optional boolean indicating whether to use radians or degrees for the phase values in the plot.
- Renvoie:
A matplotlib figure instance if the
axkwarg is not set- Type renvoyé:
- Lève:
MissingOptionalLibraryError – Requires matplotlib.
VisualizationError – if input is not a valid N-qubit state.
QiskitError – Input statevector does not have valid dimensions.
Exemples
from qiskit import QuantumCircuit
from qiskit.quantum_info import Statevector
from qiskit.visualization import plot_state_qsphere

qc = QuantumCircuit(2)
qc.h(0)
qc.cx(0, 1)

state = Statevector(qc)
plot_state_qsphere(state)
# You can show the phase of each state and use
# degrees instead of radians

from qiskit.quantum_info import DensityMatrix
import numpy as np
from qiskit import QuantumCircuit
from qiskit.visualization import plot_state_qsphere

qc = QuantumCircuit(2)
qc.h([0, 1])
qc.cz(0,1)
qc.ry(np.pi/3, 0)
qc.rx(np.pi/5, 1)
qc.z(1)

matrix = DensityMatrix(qc)
plot_state_qsphere(matrix,
     show_state_phases = True, use_degrees = True)