qiskit.visualization.plot_state_city#
- qiskit.visualization.plot_state_city(state, title='', figsize=None, color=None, alpha=1, ax_real=None, ax_imag=None, *, rho=None, filename=None)[source]#
Plot the cityscape of quantum state.
Plot two 3d bar graphs (two dimensional) of the real and imaginary part of the density matrix rho.
Obsolète depuis la version 0.15.1:
qiskit.visualization.state_visualization.plot_state_city()”s argumentrhois deprecated as of qiskit-terra 0.15.1. It will be removed no earlier than 3 months after the release date. Instead, use the argumentstate, which behaves identically.- Paramètres:
state (Statevector or DensityMatrix or ndarray) – an N-qubit quantum state.
title (str) – a string that represents the plot title
figsize (tuple) – Figure size in inches.
color (list) – A list of len=2 giving colors for real and imaginary components of matrix elements.
alpha (float) – Transparency value for bars
ax_real (matplotlib.axes.Axes) – An optional Axes object to be used for the visualization output. If none is specified a new matplotlib Figure will be created and used. If this is specified without an ax_imag only the real component plot will be generated. Additionally, if specified there will be no returned Figure since it is redundant.
ax_imag (matplotlib.axes.Axes) – An optional Axes object to be used for the visualization output. If none is specified a new matplotlib Figure will be created and used. If this is specified without an ax_real only the imaginary component plot will be generated. Additionally, if specified there will be no returned Figure since it is redundant.
- Renvoie:
The matplotlib.Figure of the visualization if the
ax_realandax_imagkwargs are not set- Type renvoyé:
- Lève:
MissingOptionalLibraryError – Requires matplotlib.
ValueError – When “color” is not a list of len=2.
VisualizationError – if input is not a valid N-qubit state.
Exemples
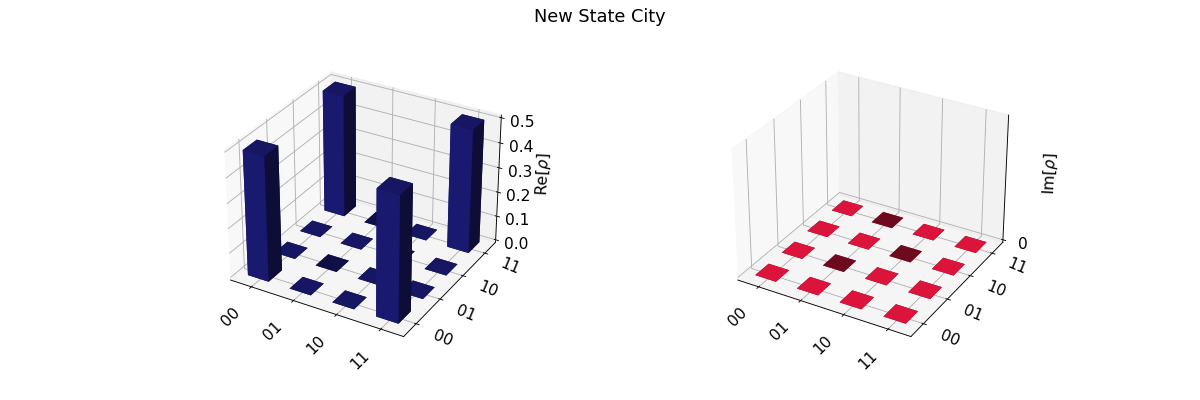
# You can choose different colors for the real and imaginary parts of the density matrix.

from qiskit import QuantumCircuit
from qiskit.quantum_info import DensityMatrix
from qiskit.visualization import plot_state_city

qc = QuantumCircuit(2)
qc.h(0)
qc.cx(0, 1)

state = DensityMatrix(qc)
plot_state_city(state, color=['midnightblue', 'crimson'], title="New State City")
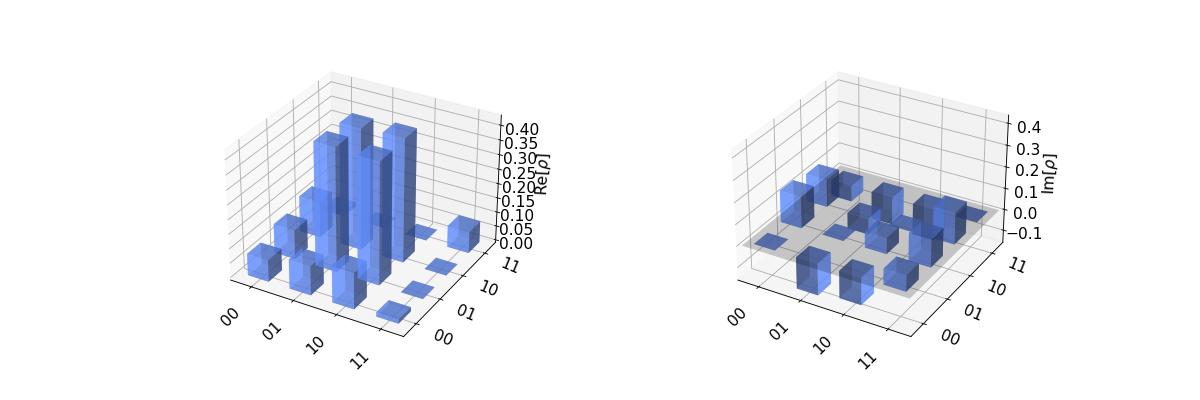
# You can make the bars more transparent to better see the ones that are behind
# if they overlap.

import numpy as np
from qiskit.quantum_info import Statevector
from qiskit.visualization import plot_state_city
from qiskit import QuantumCircuit

qc = QuantumCircuit(2)
qc.h(0)
qc.cx(0, 1)


qc = QuantumCircuit(2)
qc.h([0, 1])
qc.cz(0,1)
qc.ry(np.pi/3, 0)
qc.rx(np.pi/5, 1)

state = Statevector(qc)
plot_state_city(state, alpha=0.6)