qiskit.visualization.plot_bloch_vector#
- qiskit.visualization.plot_bloch_vector(bloch, title='', ax=None, figsize=None, coord_type='cartesian', font_size=None)[Quellcode]#
Plot the Bloch sphere.
Plot a Bloch sphere with the specified coordinates, that can be given in both cartesian and spherical systems.
- Parameter:
bloch (list[double]) – array of three elements where [<x>, <y>, <z>] (Cartesian) or [<r>, <theta>, <phi>] (spherical in radians) <theta> is inclination angle from +z direction <phi> is azimuth from +x direction
title (str) – a string that represents the plot title
ax (matplotlib.axes.Axes) – An Axes to use for rendering the bloch sphere
figsize (tuple) – Figure size in inches. Has no effect is passing
ax.coord_type (str) – a string that specifies coordinate type for bloch (Cartesian or spherical), default is Cartesian
font_size (float) – Font size.
- Rückgabe:
A matplotlib figure instance if
ax = None.- Rückgabetyp:
- Verursacht:
MissingOptionalLibraryError – Requires matplotlib.
Examples
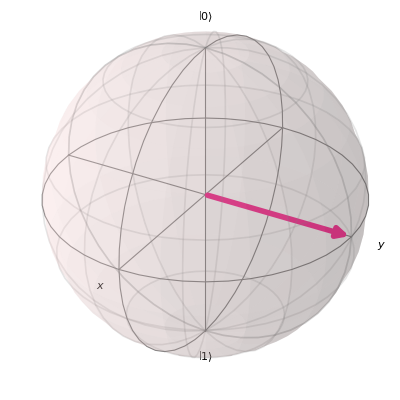
from qiskit.visualization import plot_bloch_vector

plot_bloch_vector([0,1,0], title="New Bloch Sphere")
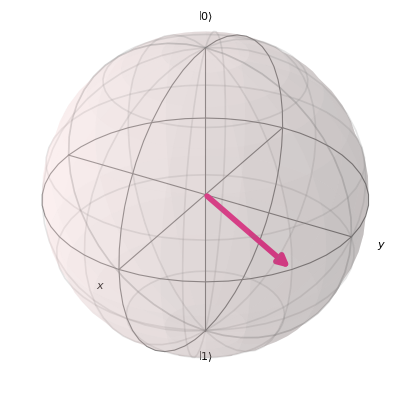
import numpy as np
from qiskit.visualization import plot_bloch_vector

# You can use spherical coordinates instead of cartesian.

plot_bloch_vector([1, np.pi/2, np.pi/3], coord_type='spherical')