plot_state_paulivec
- plot_state_paulivec(rho, title='', figsize=None, color=None, ax=None)[source]
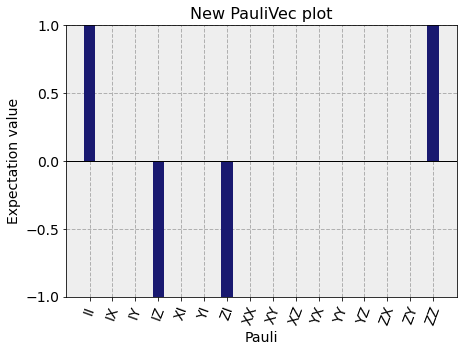
Plot the paulivec representation of a quantum state.
Plot a bargraph of the mixed state rho over the pauli matrices
- Parameters
rho (ndarray) – Numpy array for state vector or density matrix
title (str) – a string that represents the plot title
figsize (tuple) – Figure size in inches.
color (list or str) – Color of the expectation value bars.
ax (matplotlib.axes.Axes) – An optional Axes object to be used for the visualization output. If none is specified a new matplotlib Figure will be created and used. Additionally, if specified there will be no returned Figure since it is redundant.
- Returns
The matplotlib.Figure of the visualization if the
axkwarg is not set- Return type
matplotlib.Figure
- Raises
ImportError – Requires matplotlib.
Example
from qiskit import QuantumCircuit, BasicAer, execute
from qiskit.visualization import plot_state_paulivec
%matplotlib inline

qc = QuantumCircuit(2, 2)
qc.h(0)
qc.cx(0, 1)
qc.measure([0, 1], [0, 1])

backend = BasicAer.get_backend('statevector_simulator')
job = execute(qc, backend).result()
plot_state_paulivec(job.get_statevector(qc), color='midnightblue',
     title="New PauliVec plot")