plot_histogram
- plot_histogram(data, figsize=(7, 5), color=None, number_to_keep=None, sort='asc', target_string=None, legend=None, bar_labels=True, title=None, ax=None)[source]
Plot a histogram of data.
- Parameters
data (list or dict) – This is either a list of dictionaries or a single dict containing the values to represent (ex {‘001’: 130})
figsize (tuple) – Figure size in inches.
color (list or str) – String or list of strings for histogram bar colors.
number_to_keep (int) – The number of terms to plot and rest is made into a single bar called ‘rest’.
sort (string) – Could be ‘asc’, ‘desc’, or ‘hamming’.
target_string (str) – Target string if ‘sort’ is a distance measure.
legend (list) – A list of strings to use for labels of the data. The number of entries must match the length of data (if data is a list or 1 if it’s a dict)
bar_labels (bool) – Label each bar in histogram with probability value.
title (str) – A string to use for the plot title
ax (matplotlib.axes.Axes) – An optional Axes object to be used for the visualization output. If none is specified a new matplotlib Figure will be created and used. Additionally, if specified there will be no returned Figure since it is redundant.
- Returns
A figure for the rendered histogram, if the
axkwarg is not set.- Return type
matplotlib.Figure
- Raises
ImportError – Matplotlib not available.
VisualizationError – When legend is provided and the length doesn’t match the input data.
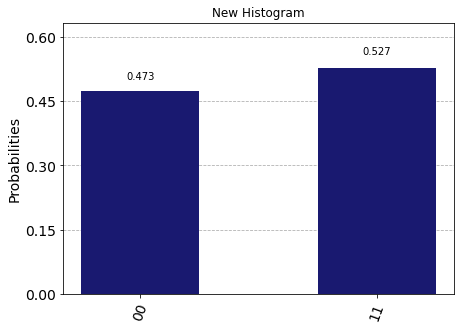
Example
from qiskit import QuantumCircuit, BasicAer, execute
from qiskit.visualization import plot_histogram
%matplotlib inline

qc = QuantumCircuit(2, 2)
qc.h(0)
qc.cx(0, 1)
qc.measure([0, 1], [0, 1])

backend = BasicAer.get_backend('qasm_simulator')
job = execute(qc, backend)
plot_histogram(job.result().get_counts(), color='midnightblue', title="New Histogram")