plot_bloch_multivector
- plot_bloch_multivector(rho, title='', figsize=None)[source]
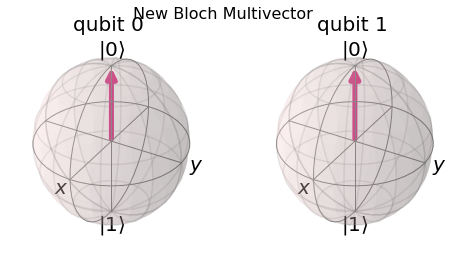
Plot the Bloch sphere.
Plot a sphere, axes, the Bloch vector, and its projections onto each axis.
- Parameters
rho (ndarray) – Numpy array for state vector or density matrix.
title (str) – a string that represents the plot title
figsize (tuple) – Has no effect, here for compatibility only.
- Returns
A matplotlib figure instance.
- Return type
matplotlib.Figure
- Raises
ImportError – Requires matplotlib.
Example
from qiskit import QuantumCircuit, BasicAer, execute
from qiskit.visualization import plot_bloch_multivector
%matplotlib inline

qc = QuantumCircuit(2, 2)
qc.h(0)
qc.cx(0, 1)
qc.measure([0, 1], [0, 1])

backend = BasicAer.get_backend('statevector_simulator')
job = execute(qc, backend).result()
plot_bloch_multivector(job.get_statevector(qc), title="New Bloch Multivector")