plot_bloch_vector
- plot_bloch_vector(bloch, title='', ax=None, figsize=None)[source]
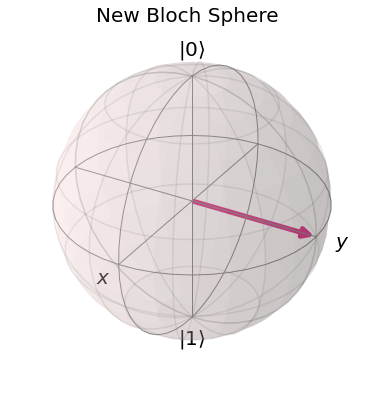
Plot the Bloch sphere.
Plot a sphere, axes, the Bloch vector, and its projections onto each axis.
- Parameters
bloch (list[double]) – array of three elements where [<x>, <y>, <z>]
title (str) – a string that represents the plot title
ax (matplotlib.axes.Axes) – An Axes to use for rendering the bloch sphere
figsize (tuple) – Figure size in inches. Has no effect is passing
ax.
- Returns
A matplotlib figure instance if
ax = None.- Return type
Figure
- Raises
ImportError – Requires matplotlib.
Example
from qiskit.visualization import plot_bloch_vector
%matplotlib inline

plot_bloch_vector([0,1,0], title="New Bloch Sphere")