qiskit.visualization.plot_state_hinton#
- qiskit.visualization.plot_state_hinton(state, title='', figsize=None, ax_real=None, ax_imag=None, *, rho=None, filename=None)[source]#
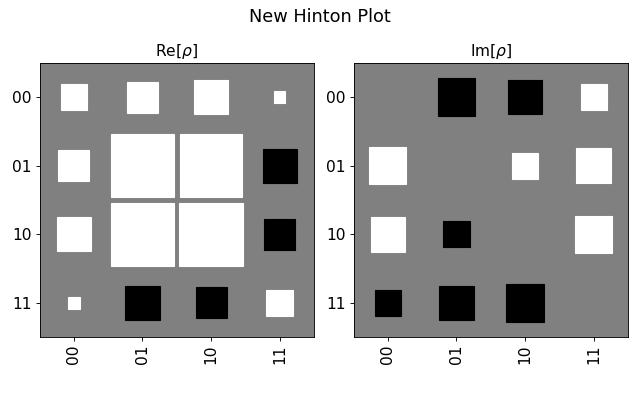
Plot a hinton diagram for the density matrix of a quantum state.
The hinton diagram represents the values of a matrix using squares, whose size indicate the magnitude of their corresponding value and their color, its sign. A white square means the value is positive and a black one means negative.
0.15.1 ভার্সন থেকে ডেপ্রিকেটেড:
qiskit.visualization.state_visualization.plot_state_hinton()'s argumentrhois deprecated as of qiskit-terra 0.15.1. It will be removed no earlier than 3 months after the release date. Instead, use the argumentstate, which behaves identically.- প্যারামিটার:
state (Statevector or DensityMatrix or ndarray) -- An N-qubit quantum state.
title (str) -- a string that represents the plot title
figsize (tuple) -- Figure size in inches.
filename (str) -- file path to save image to.
ax_real (matplotlib.axes.Axes) -- An optional Axes object to be used for the visualization output. If none is specified a new matplotlib Figure will be created and used. If this is specified without an ax_imag only the real component plot will be generated. Additionally, if specified there will be no returned Figure since it is redundant.
ax_imag (matplotlib.axes.Axes) -- An optional Axes object to be used for the visualization output. If none is specified a new matplotlib Figure will be created and used. If this is specified without an ax_imag only the real component plot will be generated. Additionally, if specified there will be no returned Figure since it is redundant.
- রিটার্নস:
The matplotlib.Figure of the visualization if neither ax_real or ax_imag is set.
- রিটার্ন টাইপ:
- রেইজেস:
MissingOptionalLibraryError -- Requires matplotlib.
VisualizationError -- if input is not a valid N-qubit state.
Examples
import numpy as np
from qiskit import QuantumCircuit
from qiskit.quantum_info import DensityMatrix
from qiskit.visualization import plot_state_hinton

qc = QuantumCircuit(2)
qc.h([0, 1])
qc.cz(0,1)
qc.ry(np.pi/3 , 0)
qc.rx(np.pi/5, 1)

state = DensityMatrix(qc)
plot_state_hinton(state, title="New Hinton Plot")