qiskit.visualization.plot_coupling_map#
- qiskit.visualization.plot_coupling_map(num_qubits, qubit_coordinates, coupling_map, figsize=None, plot_directed=False, label_qubits=True, qubit_size=None, line_width=4, font_size=None, qubit_color=None, qubit_labels=None, line_color=None, font_color='w', ax=None, filename=None)[fuente]#
Plots an arbitrary coupling map of qubits (embedded in a plane).
- Parámetros:
num_qubits (int) – The number of qubits defined and plotted.
qubit_coordinates (List[List[int]]) – A list of two-element lists, with entries of each nested list being the planar coordinates in a 0-based square grid where each qubit is located.
coupling_map (List[List[int]]) – A list of two-element lists, with entries of each nested list being the qubit numbers of the bonds to be plotted.
figsize (tuple) – Output figure size (wxh) in inches.
plot_directed (bool) – Plot directed coupling map.
label_qubits (bool) – Label the qubits.
qubit_size (float) – Size of qubit marker.
line_width (float) – Width of lines.
font_size (int) – Font size of qubit labels.
qubit_color (list) – A list of colors for the qubits
qubit_labels (list) – A list of qubit labels
line_color (list) – A list of colors for each line from coupling_map.
font_color (str) – The font color for the qubit labels.
ax (Axes) – A Matplotlib axes instance.
filename (str) – file path to save image to.
- Devuelve:
A Matplotlib figure instance.
- Tipo del valor devuelto:
Figure
- Muestra:
MissingOptionalLibraryError – if matplotlib not installed.
QiskitError – If length of qubit labels does not match number of qubits.
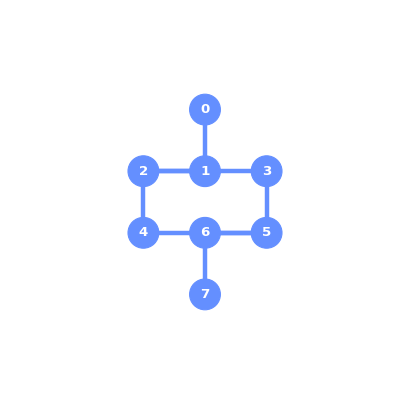
Ejemplo
from qiskit.visualization import plot_coupling_map

num_qubits = 8
qubit_coordinates = [[0, 1], [1, 1], [1, 0], [1, 2], [2, 0], [2, 2], [2, 1], [3, 1]]
coupling_map = [[0, 1], [1, 2], [2, 3], [3, 5], [4, 5], [5, 6], [2, 4], [6, 7]]
plot_coupling_map(num_qubits, qubit_coordinates, coupling_map)