plot_gate_map
- plot_gate_map(backend, figsize=None, plot_directed=False, label_qubits=True, qubit_size=24, line_width=4, font_size=12, qubit_color=None, qubit_labels=None, line_color=None, font_color='w', ax=None)[source]
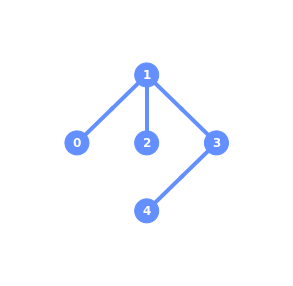
Plots the gate map of a device.
- Parameters
backend (BaseBackend) – A backend instance,
figsize (tuple) – Output figure size (wxh) in inches.
plot_directed (bool) – Plot directed coupling map.
label_qubits (bool) – Label the qubits.
qubit_size (float) – Size of qubit marker.
line_width (float) – Width of lines.
font_size (int) – Font size of qubit labels.
qubit_color (list) – A list of colors for the qubits
qubit_labels (list) – A list of qubit labels
line_color (list) – A list of colors for each line from coupling_map.
font_color (str) – The font color for the qubit labels.
ax (Axes) – A Matplotlib axes instance.
- Returns
A Matplotlib figure instance.
- Return type
Figure
- Raises
QiskitError – if tried to pass a simulator.
ImportError – if matplotlib not installed.
Example
from qiskit import QuantumCircuit, execute, IBMQ
from qiskit.visualization import plot_gate_map
%matplotlib inline

provider = IBMQ.load_account()
accountProvider = IBMQ.get_provider(hub='ibm-q')
backend = accountProvider.get_backend('ibmq_vigo')
plot_gate_map(backend)