plot_error_map
- plot_error_map(backend, figsize=(12, 9), show_title=True)[source]
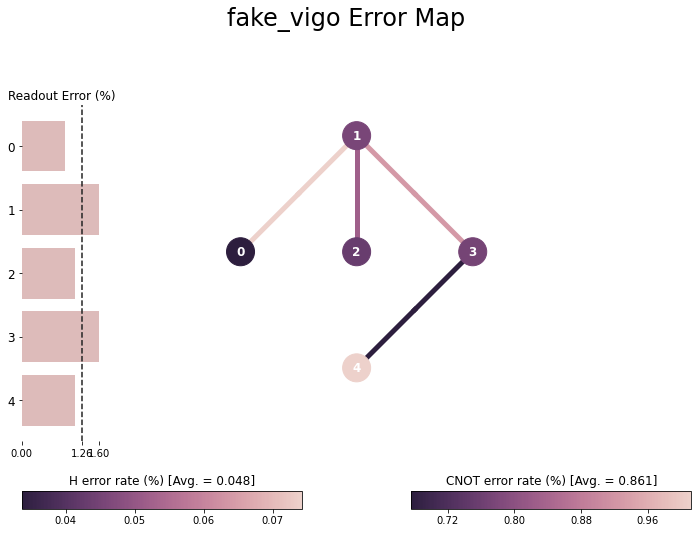
Plots the error map of a given backend.
- Parameters
backend (IBMQBackend) – Given backend.
figsize (tuple) – Figure size in inches.
show_title (bool) – Show the title or not.
- Returns
A matplotlib figure showing error map.
- Return type
Figure
- Raises
VisualizationError – Input is not IBMQ backend.
ImportError – If seaborn is not installed
Example
from qiskit import QuantumCircuit, execute, IBMQ
from qiskit.visualization import plot_error_map
%matplotlib inline

IBMQ.load_account()
provider = IBMQ.get_provider(hub='ibm-q')
backend = provider.get_backend('ibmq_vigo')
plot_error_map(backend)