dag_drawer
- dag_drawer(dag, scale=0.7, filename=None, style='color')[source]
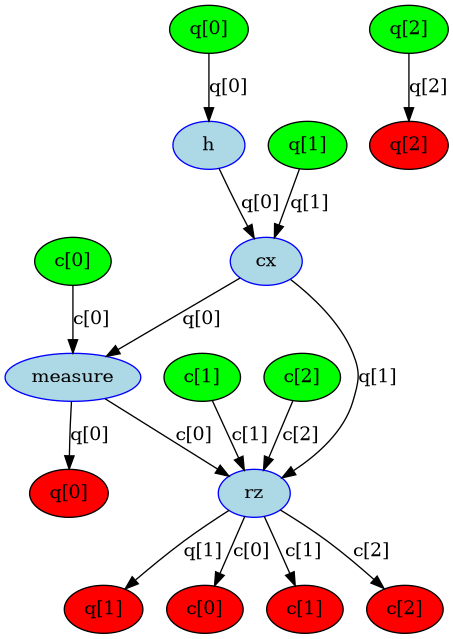
Plot the directed acyclic graph (dag) to represent operation dependencies in a quantum circuit.
Note this function leverages pydot to generate the graph, which means that having Graphviz installed on your system is required for this to work.
The current release of Graphviz can be downloaded here: <https://graphviz.gitlab.io/download/>. Download the version of the sotware that matches your environment and follow the instructions to install Graph Visualization Software (Graphviz) on your operating system.
- Parameters
dag (DAGCircuit) – The dag to draw.
scale (float) – scaling factor
filename (str) – file path to save image to (format inferred from name)
style (str) – ‘plain’: B&W graph ‘color’ (default): color input/output/op nodes
- Returns
- if in Jupyter notebook and not saving to file,
otherwise None.
- Return type
PIL.Image
- Raises
VisualizationError – when style is not recognized.
ImportError – when pydot or pillow are not installed.
Example
%matplotlib inline
from qiskit import QuantumRegister, ClassicalRegister, QuantumCircuit
from qiskit.dagcircuit import DAGCircuit
from qiskit.converters import circuit_to_dag
from qiskit.visualization import dag_drawer

q = QuantumRegister(3, 'q')
c = ClassicalRegister(3, 'c')
circ = QuantumCircuit(q, c)
circ.h(q[0])
circ.cx(q[0], q[1])
circ.measure(q[0], c[0])
circ.rz(0.5, q[1]).c_if(c, 2)

dag = circuit_to_dag(circ)
dag_drawer(dag)