qiskit.visualization.plot_histogram
- qiskit.visualization.plot_histogram(data, figsize=(7, 5), color=None, number_to_keep=None, sort='asc', target_string=None, legend=None, bar_labels=True, title=None, ax=None, filename=None)[source]
Plot a histogram of input counts data.
Deprecated since version 0.22.0_pending: Using plot_histogram()
dataargument with QuasiDistribution, ProbDistribution, or a distribution dictionary is pending deprecation as of qiskit-terra 0.22.0. It will be marked deprecated in a future release, and then removed no earlier than 3 months after the release date. Instead, useplot_distribution().- Parameters:
data (list or dict) – This is either a list of dictionaries or a single dict containing the values to represent (ex
{'001': 130})figsize (tuple) – Figure size in inches.
color (list or str) – String or list of strings for histogram bar colors.
number_to_keep (int) – The number of terms to plot per dataset. The rest is made into a single bar called ‘rest’. If multiple datasets are given, the
number_to_keepapplies to each dataset individually, which may result in more bars thannumber_to_keep + 1. Thenumber_to_keepapplies to the total values, rather than the x-axis sort.sort (string) – Could be ‘asc’, ‘desc’, ‘hamming’, ‘value’, or ‘value_desc’. If set to ‘value’ or ‘value_desc’ the x axis will be sorted by the number of counts for each bitstring. Defaults to ‘asc’.
target_string (str) – Target string if ‘sort’ is a distance measure.
legend (list) – A list of strings to use for labels of the data. The number of entries must match the length of data (if data is a list or 1 if it’s a dict)
bar_labels (bool) – Label each bar in histogram with counts value.
title (str) – A string to use for the plot title
ax (matplotlib.axes.Axes) – An optional Axes object to be used for the visualization output. If none is specified a new matplotlib Figure will be created and used. Additionally, if specified there will be no returned Figure since it is redundant.
filename (str) – file path to save image to.
- Returns:
A figure for the rendered histogram, if the
axkwarg is not set.- Return type:
matplotlib.Figure
- Raises:
MissingOptionalLibraryError – Matplotlib not available.
VisualizationError – When legend is provided and the length doesn’t match the input data.
VisualizationError – Input must be Counts or a dict
Examples
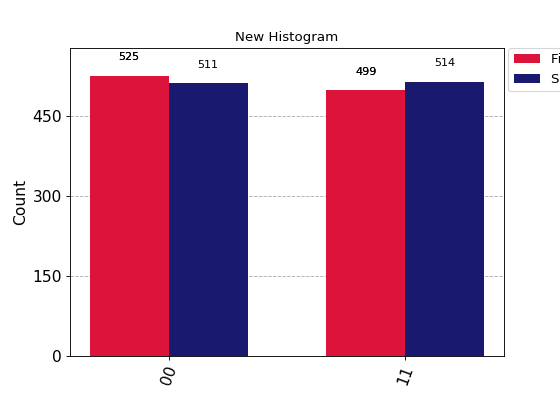
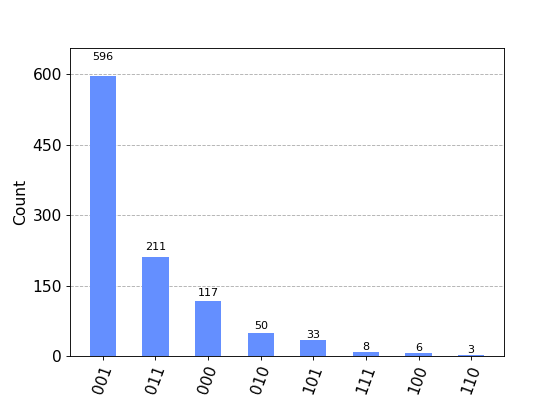
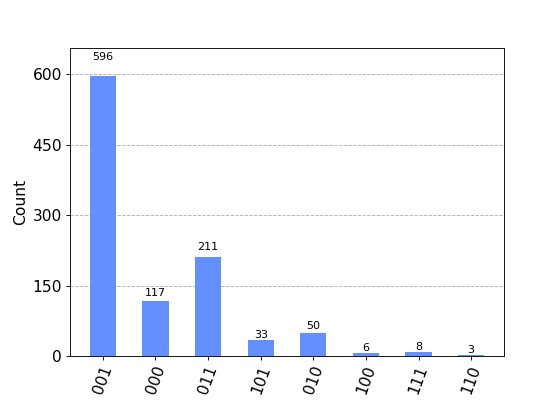
# Plot two counts in the same figure with legends and colors specified.

from qiskit.visualization import plot_histogram

counts1 = {'00': 525, '11': 499}
counts2 = {'00': 511, '11': 514}

legend = ['First execution', 'Second execution']

plot_histogram([counts1, counts2], legend=legend, color=['crimson','midnightblue'],
                title="New Histogram")

# You can sort the bitstrings using different methods.

counts = {'001': 596, '011': 211, '010': 50, '000': 117, '101': 33, '111': 8,
        '100': 6, '110': 3}

# Sort by the counts in descending order
hist1 = plot_histogram(counts, sort='value_desc')

# Sort by the hamming distance (the number of bit flips to change from
# one bitstring to the other) from a target string.
hist2 = plot_histogram(counts, sort='hamming', target_string='001')