qiskit.visualization.plot_gate_map
- qiskit.visualization.plot_gate_map(backend, figsize=None, plot_directed=False, label_qubits=True, qubit_size=None, line_width=4, font_size=None, qubit_color=None, qubit_labels=None, line_color=None, font_color='white', ax=None, filename=None, qubit_coordinates=None)[source]
Plots the gate map of a device.
- Parameters:
backend (Backend) – The backend instance that will be used to plot the device gate map.
figsize (tuple) – Output figure size (wxh) in inches.
plot_directed (bool) – Plot directed coupling map.
label_qubits (bool) – Label the qubits.
qubit_size (float) – Size of qubit marker.
line_width (float) – Width of lines.
font_size (int) – Font size of qubit labels.
qubit_color (list) – A list of colors for the qubits
qubit_labels (list) – A list of qubit labels
line_color (list) – A list of colors for each line from coupling_map.
font_color (str) – The font color for the qubit labels.
ax (Axes) – A Matplotlib axes instance.
filename (str) – file path to save image to.
qubit_coordinates (Sequence) – An optional sequence input (list or array being the most common) of 2d coordinates for each qubit. The length of the sequence much match the number of qubits on the backend. The sequence should be the planar coordinates in a 0-based square grid where each qubit is located.
- Returns:
A Matplotlib figure instance.
- Return type:
Figure
- Raises:
QiskitError – if tried to pass a simulator, or if the backend is None, but one of num_qubits, mpl_data, or cmap is None.
MissingOptionalLibraryError – if matplotlib not installed.
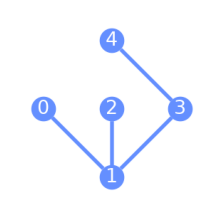
Example
from qiskit import QuantumCircuit, execute
from qiskit.providers.fake_provider import FakeVigoV2
from qiskit.visualization import plot_gate_map

backend = FakeVigoV2()

plot_gate_map(backend)