qiskit.visualization.plot_state_qsphere
-
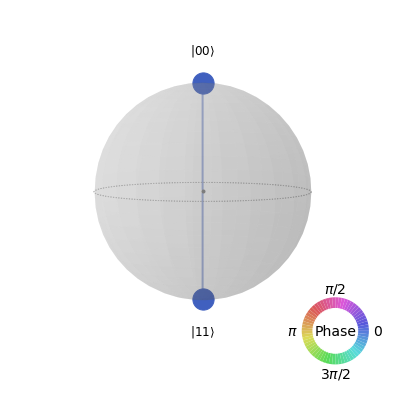
plot_state_qsphere(state, figsize=None, ax=None, show_state_labels=True, show_state_phases=False, use_degrees=False, *, rho=None)[source]¶ Plot the qsphere representation of a quantum state. Here, the size of the points is proportional to the probability of the corresponding term in the state and the color represents the phase.
- Parameters
state (Statevector or DensityMatrix or ndarray) – an N-qubit quantum state.
figsize (tuple) – Figure size in inches.
ax (matplotlib.axes.Axes) – An optional Axes object to be used for the visualization output. If none is specified a new matplotlib Figure will be created and used. Additionally, if specified there will be no returned Figure since it is redundant.
show_state_labels (bool) – An optional boolean indicating whether to show labels for each basis state.
show_state_phases (bool) – An optional boolean indicating whether to show the phase for each basis state.
use_degrees (bool) – An optional boolean indicating whether to use radians or degrees for the phase values in the plot.
- Returns
A matplotlib figure instance if the
axkwarg is not set- Return type
Figure
- Raises
MissingOptionalLibraryError – Requires matplotlib.
VisualizationError – if input is not a valid N-qubit state.
QiskitError – Input statevector does not have valid dimensions.
Example
from qiskit import QuantumCircuit
from qiskit.quantum_info import Statevector
from qiskit.visualization import plot_state_qsphere
%matplotlib inline

qc = QuantumCircuit(2)
qc.h(0)
qc.cx(0, 1)

state = Statevector.from_instruction(qc)
plot_state_qsphere(state)