qiskit.visualization.plot_state_hinton
-
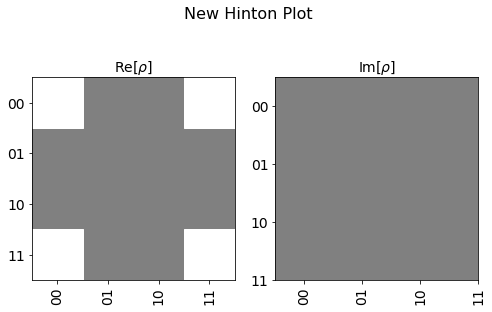
plot_state_hinton(state, title='', figsize=None, ax_real=None, ax_imag=None, *, rho=None)[source]¶ Plot a hinton diagram for the density matrix of a quantum state.
- Parameters
state (Statevector or DensityMatrix or ndarray) – An N-qubit quantum state.
title (str) – a string that represents the plot title
figsize (tuple) – Figure size in inches.
ax_real (matplotlib.axes.Axes) – An optional Axes object to be used for the visualization output. If none is specified a new matplotlib Figure will be created and used. If this is specified without an ax_imag only the real component plot will be generated. Additionally, if specified there will be no returned Figure since it is redundant.
ax_imag (matplotlib.axes.Axes) – An optional Axes object to be used for the visualization output. If none is specified a new matplotlib Figure will be created and used. If this is specified without an ax_imag only the real component plot will be generated. Additionally, if specified there will be no returned Figure since it is redundant.
- Returns
The matplotlib.Figure of the visualization if neither ax_real or ax_imag is set.
- Return type
matplotlib.Figure
- Raises
MissingOptionalLibraryError – Requires matplotlib.
VisualizationError – if input is not a valid N-qubit state.
Example
from qiskit import QuantumCircuit
from qiskit.quantum_info import DensityMatrix
from qiskit.visualization import plot_state_hinton
%matplotlib inline

qc = QuantumCircuit(2)
qc.h(0)
qc.cx(0, 1)

state = DensityMatrix.from_instruction(qc)
plot_state_hinton(state, title="New Hinton Plot")