qiskit.visualization.plot_bloch_multivector
-
plot_bloch_multivector(state, title='', figsize=None, *, rho=None, reverse_bits=False)[source]¶ Plot the Bloch sphere.
Plot a sphere, axes, the Bloch vector, and its projections onto each axis.
- Parameters
state (Statevector or DensityMatrix or ndarray) – an N-qubit quantum state.
title (str) – a string that represents the plot title
figsize (tuple) – Has no effect, here for compatibility only.
reverse_bits (bool) – If True, plots qubits following Qiskit’s convention [Default:False].
- Returns
A matplotlib figure instance.
- Return type
matplotlib.Figure
- Raises
MissingOptionalLibraryError – Requires matplotlib.
VisualizationError – if input is not a valid N-qubit state.
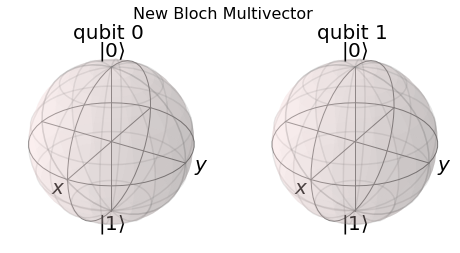
Example
from qiskit import QuantumCircuit
from qiskit.quantum_info import Statevector
from qiskit.visualization import plot_bloch_multivector
%matplotlib inline

qc = QuantumCircuit(2)
qc.h(0)
qc.cx(0, 1)

state = Statevector.from_instruction(qc)
plot_bloch_multivector(state, title="New Bloch Multivector", reverse_bits=False)