Note
This page was generated from tutorials/noise/2_relaxation_and_decoherence.ipynb.
Run interactively in the IBM Quantum lab.
Relaxation and Decoherence
This notebook gives examples for how to use the ignis.characterization.coherence module for measuring \(T_1\) and \(T_2\).
[1]:
import numpy as np
import matplotlib.pyplot as plt

import qiskit
from qiskit.providers.aer.noise.errors.standard_errors import thermal_relaxation_error
from qiskit.providers.aer.noise import NoiseModel

from qiskit.ignis.characterization.coherence import T1Fitter, T2StarFitter, T2Fitter
from qiskit.ignis.characterization.coherence import t1_circuits, t2_circuits, t2star_circuits
Generation of coherence circuits
This shows how to generate the circuits. The list of qubits specifies for which qubits to generate characterization circuits; these circuits will run in parallel. The discrete unit of time is the identity gate (iden) and so the user must specify the time of each identity gate if they would like the characterization parameters returned in units of time. This should be available from the backend.
[2]:
num_of_gates = (np.linspace(10, 300, 50)).astype(int)
gate_time = 0.1

# Note that it is possible to measure several qubits in parallel
qubits = [0, 2]

t1_circs, t1_xdata = t1_circuits(num_of_gates, gate_time, qubits)
t2star_circs, t2star_xdata, osc_freq = t2star_circuits(num_of_gates, gate_time, qubits, nosc=5)
t2echo_circs, t2echo_xdata = t2_circuits(np.floor(num_of_gates/2).astype(int),
                                         gate_time, qubits)
t2cpmg_circs, t2cpmg_xdata = t2_circuits(np.floor(num_of_gates/6).astype(int),
                                         gate_time, qubits,
                                         n_echos=5, phase_alt_echo=True)
Backend execution
[3]:
backend = qiskit.Aer.get_backend('qasm_simulator')
shots = 400

# Let the simulator simulate the following times for qubits 0 and 2:
t_q0 = 25.0
t_q2 = 15.0

# Define T1 and T2 noise:
t1_noise_model = NoiseModel()
t1_noise_model.add_quantum_error(
    thermal_relaxation_error(t_q0, 2*t_q0, gate_time),
    'id', [0])
t1_noise_model.add_quantum_error(
    thermal_relaxation_error(t_q2, 2*t_q2, gate_time),
    'id', [2])

t2_noise_model = NoiseModel()
t2_noise_model.add_quantum_error(
    thermal_relaxation_error(np.inf, t_q0, gate_time, 0.5),
    'id', [0])
t2_noise_model.add_quantum_error(
    thermal_relaxation_error(np.inf, t_q2, gate_time, 0.5),
    'id', [2])

# Run the simulator
t1_backend_result = qiskit.execute(t1_circs, backend, shots=shots,
                                   noise_model=t1_noise_model, optimization_level=0).result()
t2star_backend_result = qiskit.execute(t2star_circs, backend, shots=shots,
                                       noise_model=t2_noise_model, optimization_level=0).result()
t2echo_backend_result = qiskit.execute(t2echo_circs, backend, shots=shots,
                                       noise_model=t2_noise_model, optimization_level=0).result()

# It is possible to split the circuits into multiple jobs and then give the results to the fitter as a list:
t2cpmg_backend_result1 = qiskit.execute(t2cpmg_circs[0:5], backend,
                                        shots=shots, noise_model=t2_noise_model,
                                        optimization_level=0).result()
t2cpmg_backend_result2 = qiskit.execute(t2cpmg_circs[5:], backend,
                                        shots=shots, noise_model=t2_noise_model,
                                        optimization_level=0).result()
Analysis of results
[4]:
# Fitting T1

%matplotlib inline

plt.figure(figsize=(15, 6))

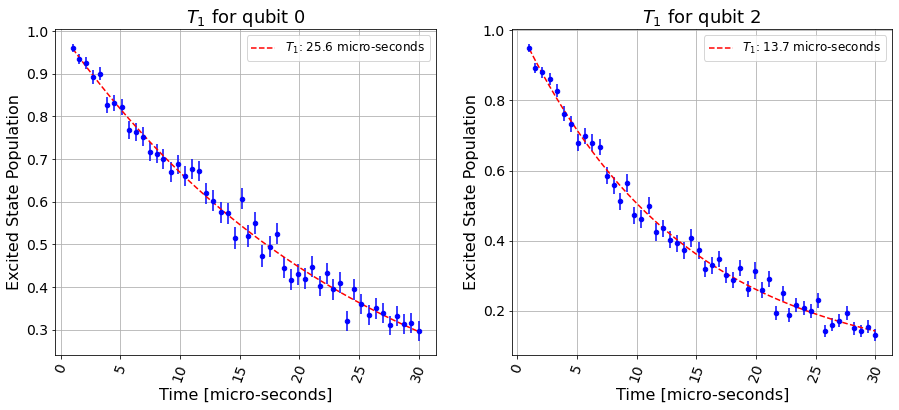
t1_fit = T1Fitter(t1_backend_result, t1_xdata, qubits,
                  fit_p0=[1, t_q0, 0],
                  fit_bounds=([0, 0, -1], [2, 40, 1]))
print(t1_fit.time())
print(t1_fit.time_err())
print(t1_fit.params)
print(t1_fit.params_err)

for i in range(2):
    ax = plt.subplot(1, 2, i+1)
    t1_fit.plot(i, ax=ax)
plt.show()
[25.575655453643254, 13.697323422482578]
[2.6082151877374176, 0.741651425558054]
{'0': [array([ 1.01703855e+00,  2.55756555e+01, -1.91494792e-02]), array([ 0.98361372, 13.69732342,  0.03273215])]}
{'0': [array([0.05754569, 2.60821519, 0.06202403]), array([0.01688686, 0.74165143, 0.020372  ])]}

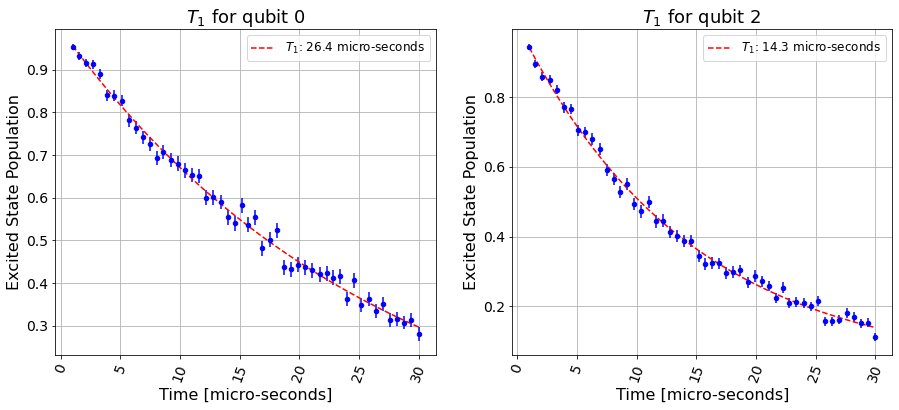
Execute the backend again to get more statistics, and add the results to the previous ones:
[5]:
t1_backend_result_new = qiskit.execute(t1_circs, backend,
                                       shots=shots, noise_model=t1_noise_model,
                                       optimization_level=0).result()
t1_fit.add_data(t1_backend_result_new)

plt.figure(figsize=(15, 6))
for i in range(2):
    ax = plt.subplot(1, 2, i+1)
    t1_fit.plot(i, ax=ax)
plt.show()

[6]:
# Fitting T2*

%matplotlib inline

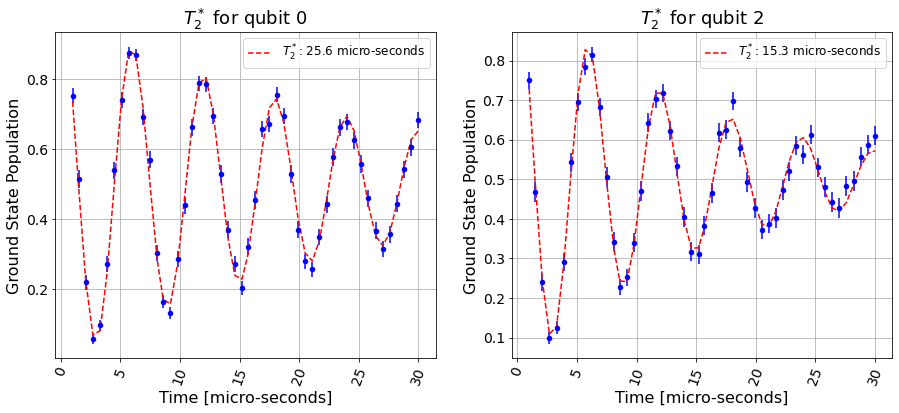
t2star_fit = T2StarFitter(t2star_backend_result, t2star_xdata, qubits,
                          fit_p0=[0.5, t_q0, osc_freq, 0, 0.5],
                          fit_bounds=([-0.5, 0, 0, -np.pi, -0.5],
                                      [1.5, 40, 2*osc_freq, np.pi, 1.5]))

plt.figure(figsize=(15, 6))
for i in range(2):
    ax = plt.subplot(1, 2, i+1)
    t2star_fit.plot(i, ax=ax)
plt.show()

[7]:
# Fitting T2 single echo

%matplotlib inline

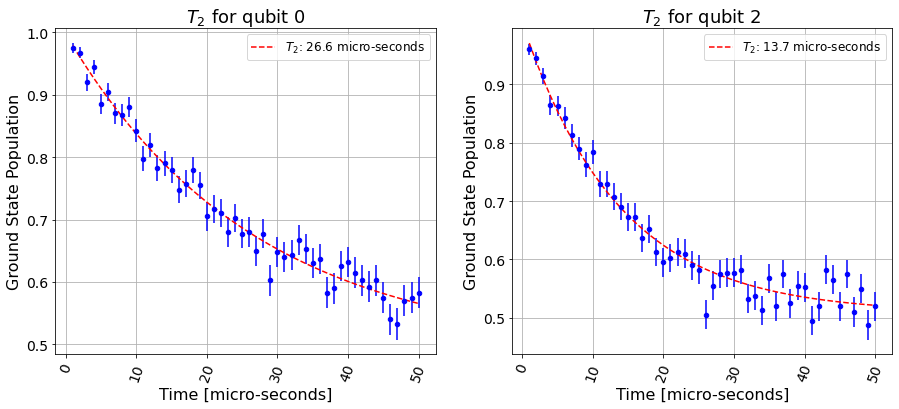
t2echo_fit = T2Fitter(t2echo_backend_result, t2echo_xdata, qubits,
                      fit_p0=[0.5, t_q0, 0.5],
                      fit_bounds=([-0.5, 0, -0.5],
                                  [1.5, 40, 1.5]))

print(t2echo_fit.params)

plt.figure(figsize=(15, 6))
for i in range(2):
    ax = plt.subplot(1, 2, i+1)
    t2echo_fit.plot(i, ax=ax)
plt.show()
{'0': [array([ 0.47532692, 22.31429973, 0.52574255]), array([ 0.50274616, 13.49221367, 0.51415422])]}

[8]:
# Fitting T2 CPMG

%matplotlib inline

t2cpmg_fit = T2Fitter([t2cpmg_backend_result1, t2cpmg_backend_result2],
                      t2cpmg_xdata, qubits,
                      fit_p0=[0.5, t_q0, 0.5],
                      fit_bounds=([-0.5, 0, -0.5],
                                  [1.5, 40, 1.5]))

plt.figure(figsize=(15, 6))
for i in range(2):
    ax = plt.subplot(1, 2, i+1)
    t2cpmg_fit.plot(i, ax=ax)
plt.show()

[9]:
import qiskit.tools.jupyter
%qiskit_version_table
%qiskit_copyright
Version Information
| Qiskit Software | Version |
|---|---|
| Qiskit | 0.26.2 |
| Terra | 0.17.4 |
| Aer | 0.8.2 |
| Ignis | 0.6.0 |
| Aqua | 0.9.1 |
| IBM Q Provider | 0.13.1 |
| System information | |
| Python | 3.7.7 (default, Apr 22 2020, 19:15:10) [GCC 9.3.0] |
| OS | Linux |
| CPUs | 32 |
| Memory (Gb) | 125.71903228759766 |
| Tue May 25 17:28:01 2021 EDT | |
This code is a part of Qiskit
© Copyright IBM 2017, 2021.
This code is licensed under the Apache License, Version 2.0. You may
obtain a copy of this license in the LICENSE.txt file in the root directory
of this source tree or at http://www.apache.org/licenses/LICENSE-2.0.
Any modifications or derivative works of this code must retain this
copyright notice, and modified files need to carry a notice indicating
that they have been altered from the originals.
[ ]: